

WS 2017/2018
Interactive Plots for Global and Local Interpretations
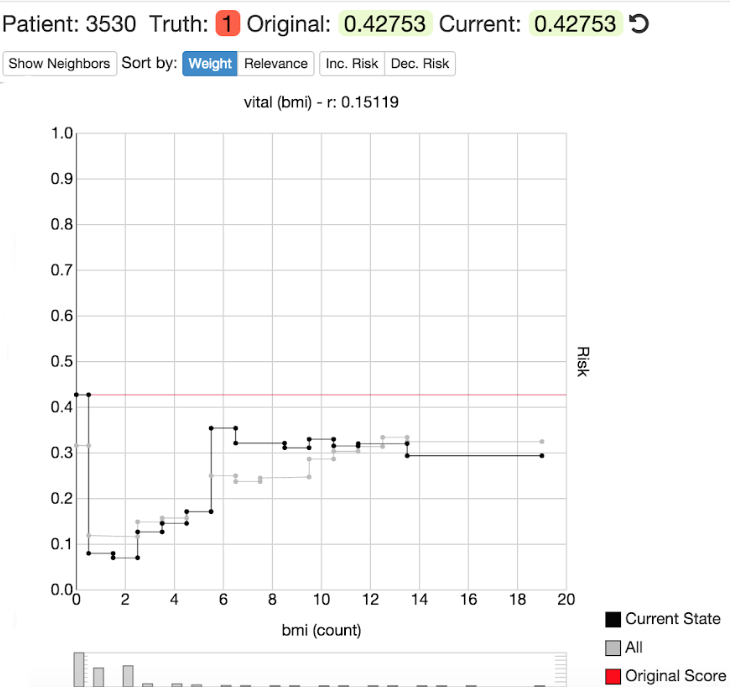
Individual conditional expectation curves (ICE) is a visual tool that shows the partial effect of a feature on the predicted target outcome for one observation. The following figure shows an ICE curve for a single observation.
The ICE curve of this observation shows the effect of a feature on the target outcome. Using the sliders on the left side, a user can change the value of other features and interactively see how the ICE curve changes. The goal of this project is to write an R package that allows users to produce interactive ICE curves and partial dependence curves (the average of all ICE curves). The user is to be able to change the value of the other features to see how changes in other feature values affect the ICE (and PD) curves.
Interactive Plots and Tables for Benchmarking Results
The benchmarking results of machine learning models usually follow the same structure. The goal of machine learning benchmarking is to find out which algorithm or algorithm setting performs best (e.g. in terms of accuracy or speed) on a set of data problems. The dataset with the benchmark results stores information about the algorithms used, the data problem used, the algorithm parameters, the problem parameters, the concrete results.
The goal of this project is to write an R package that allows users to produce interactive plots and tables for machine learning benchmarking results.
Explaining machine learning predictions with game theory
Explaining how a machine learning model comes to a certain prediction is intransparent, yet there are many reasons why people want their machine models to be interpretable (trust, “debugging” of the model, legal reasons, etc.). However, there is a method to explain predictions of a machine learning model. The Shapley value is an approach from the game theory which can calculate the distribution of each feature towards a prediction of a datapoint.
In machine learning, the features (=players) work together to get the payout (=predicted value). The Shapley value tells us, how much each feature contributes to the prediction. The goal of this project is to implement the Shapley value in an R package and to provide methods for visualizing the results.
Automatic statistician for explanatory data analysis on OpenML Data
Writing exploratory data analysis (EDA) scripts helps in extracting valuable information from the data but can be very time consuming. People are often producing the same tables and figures again and again which could be automatized with EDA scripts. The goal of this project is to write an R package that automatically generates EDA reports for Datasets and applies this to Datasets from OpenML. Using Markdown users can simply produce HTML (with interactive plots) as well as PDF reports.